How to Read Gold Charts: Key Levels, Structure & Entry Basics
May 8

Reading gold (XAU/USD) charts is about understanding how price moves between key levels and how it reacts when it reaches them. Instead of relying heavily on indicators, traders first learn to interpret structure, levels, and price behaviour.This foundation is essential before applying any trading strategy.
1. Identify Market Direction First
The first step in reading any gold chart is determining the overall direction of the market. Understanding whether gold is trending higher, trending lower, or moving sideways helps traders avoid taking trades against prevailing momentum.
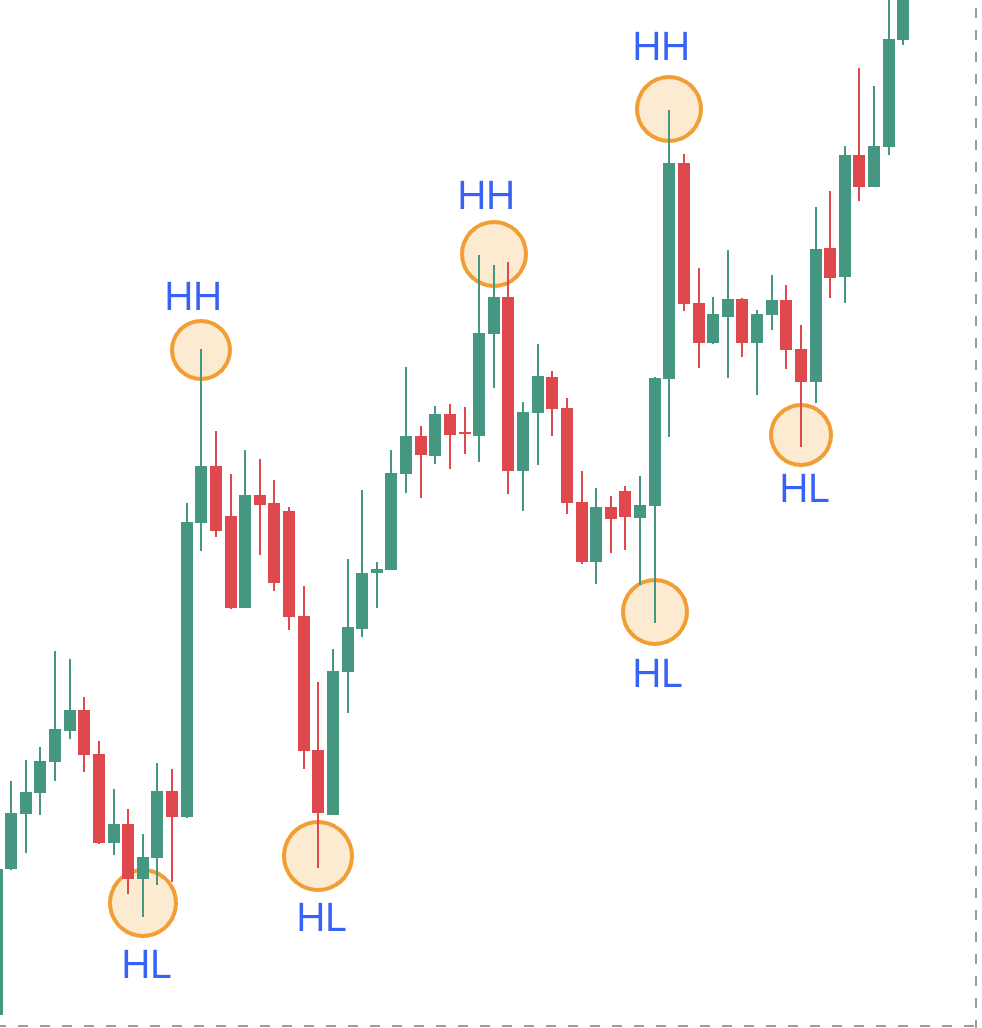
- Uptrend: Price forms higher highs and higher lows
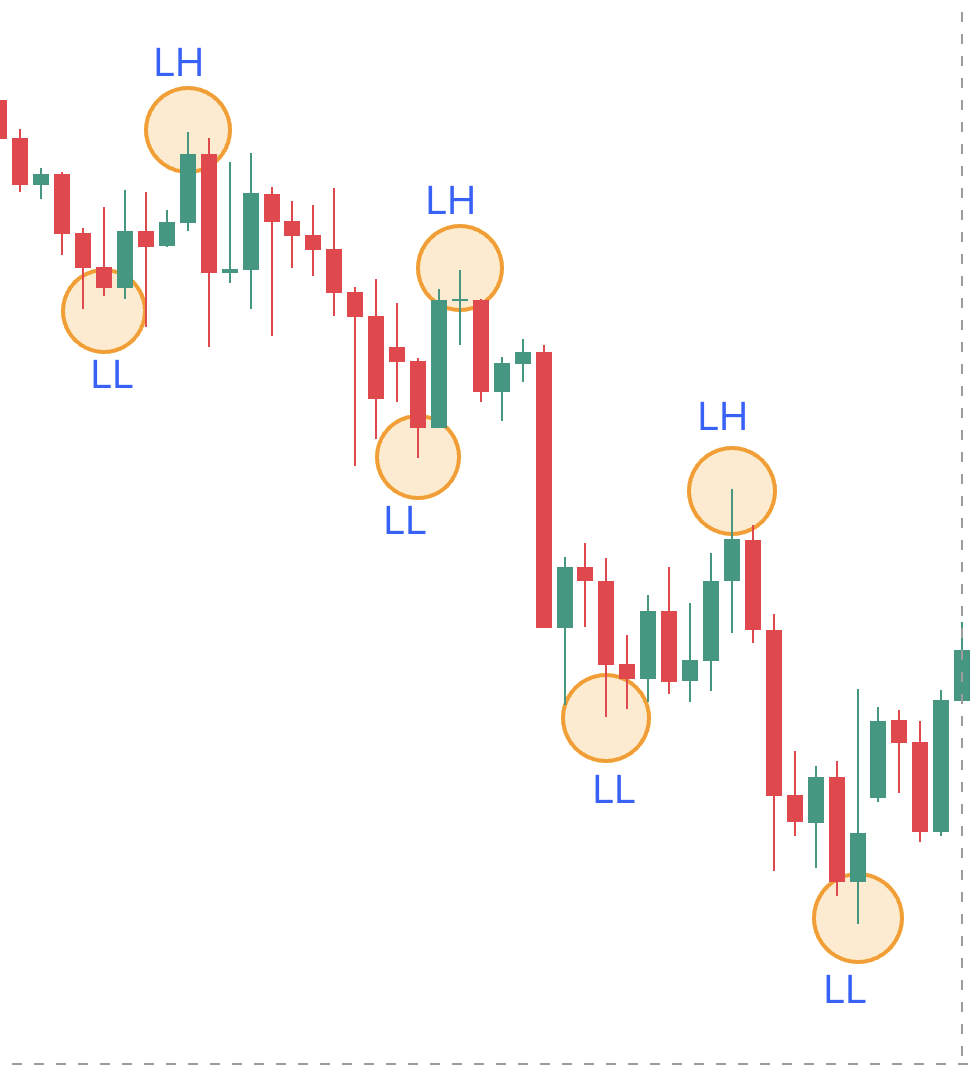
- Downtrend: Price forms lower highs and lower lows
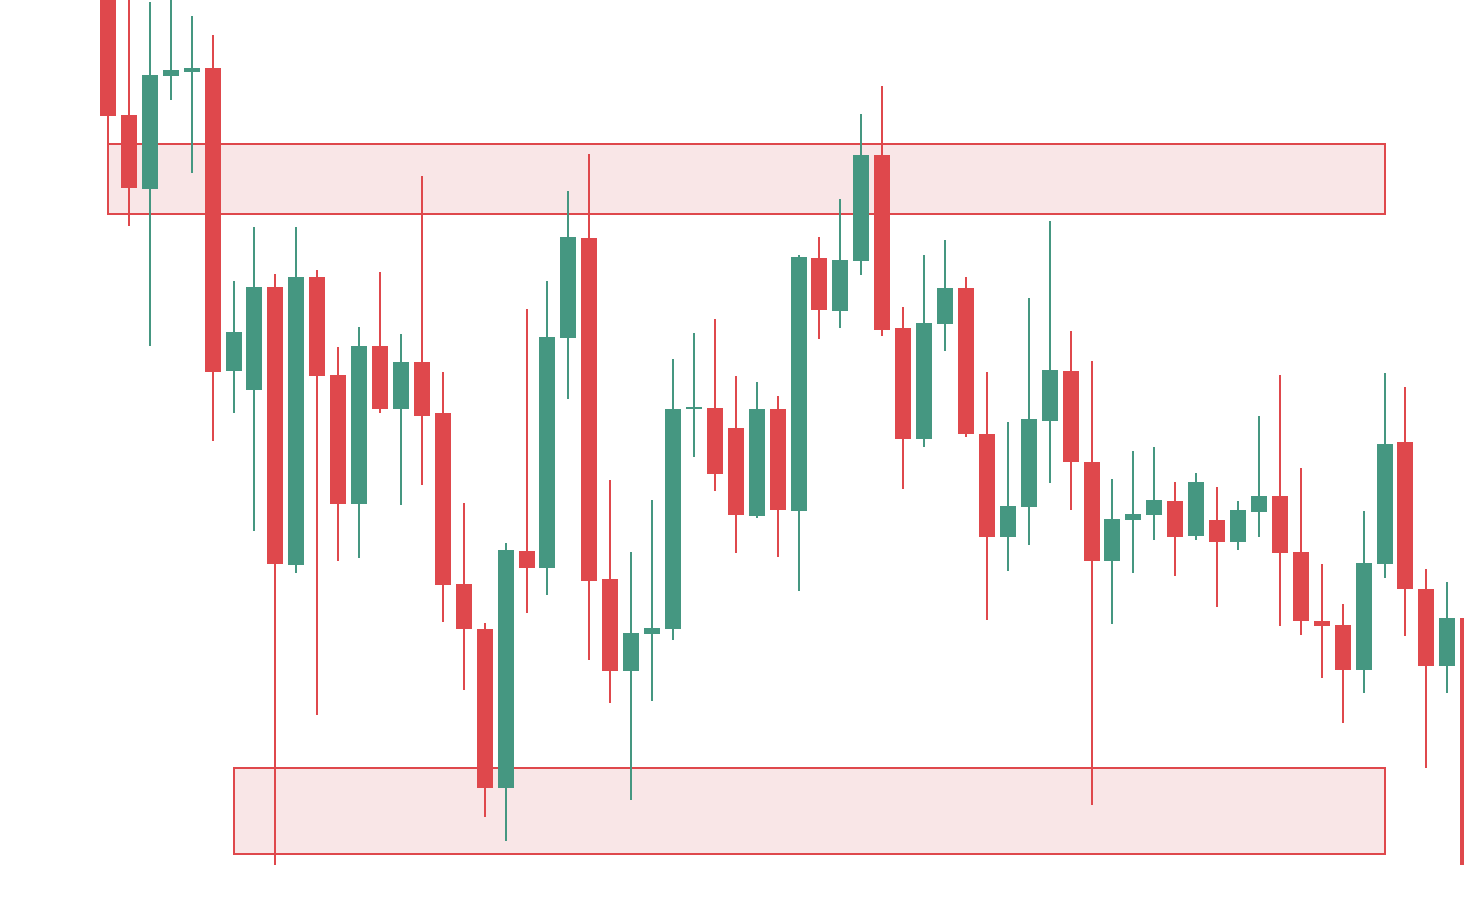
- Range: Price moves sideways between defined boundaries
When the direction is unclear, it is often better to remain patient and wait for a cleaner structure to develop rather than forcing trades in uncertain conditions.
2. Mark Key Levels (Areas of Interest)
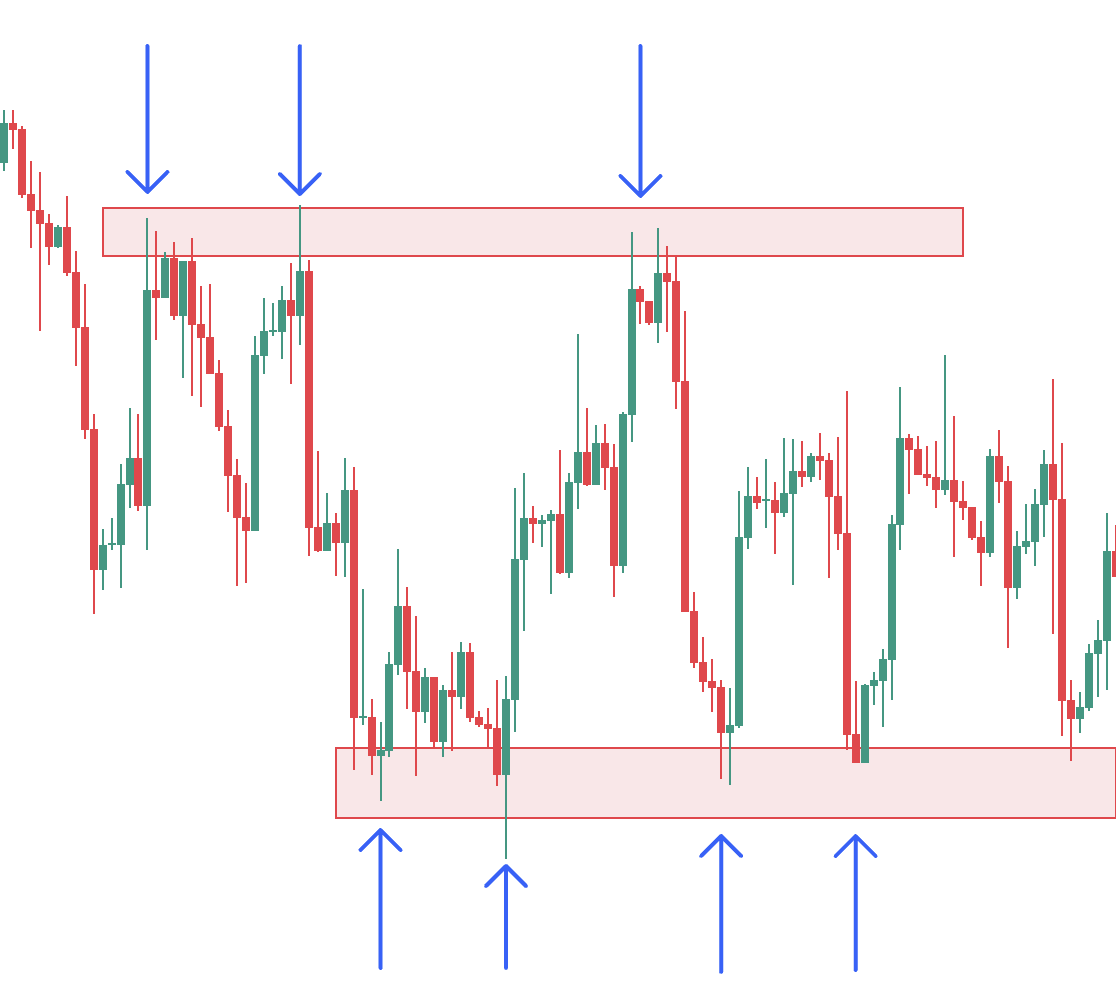
Key levels are areas where price has previously reacted significantly. Since buyers and sellers often monitor these levels, they can play an important role in shaping future price direction.
Common key levels include:
- Previous swing highs and swing lows
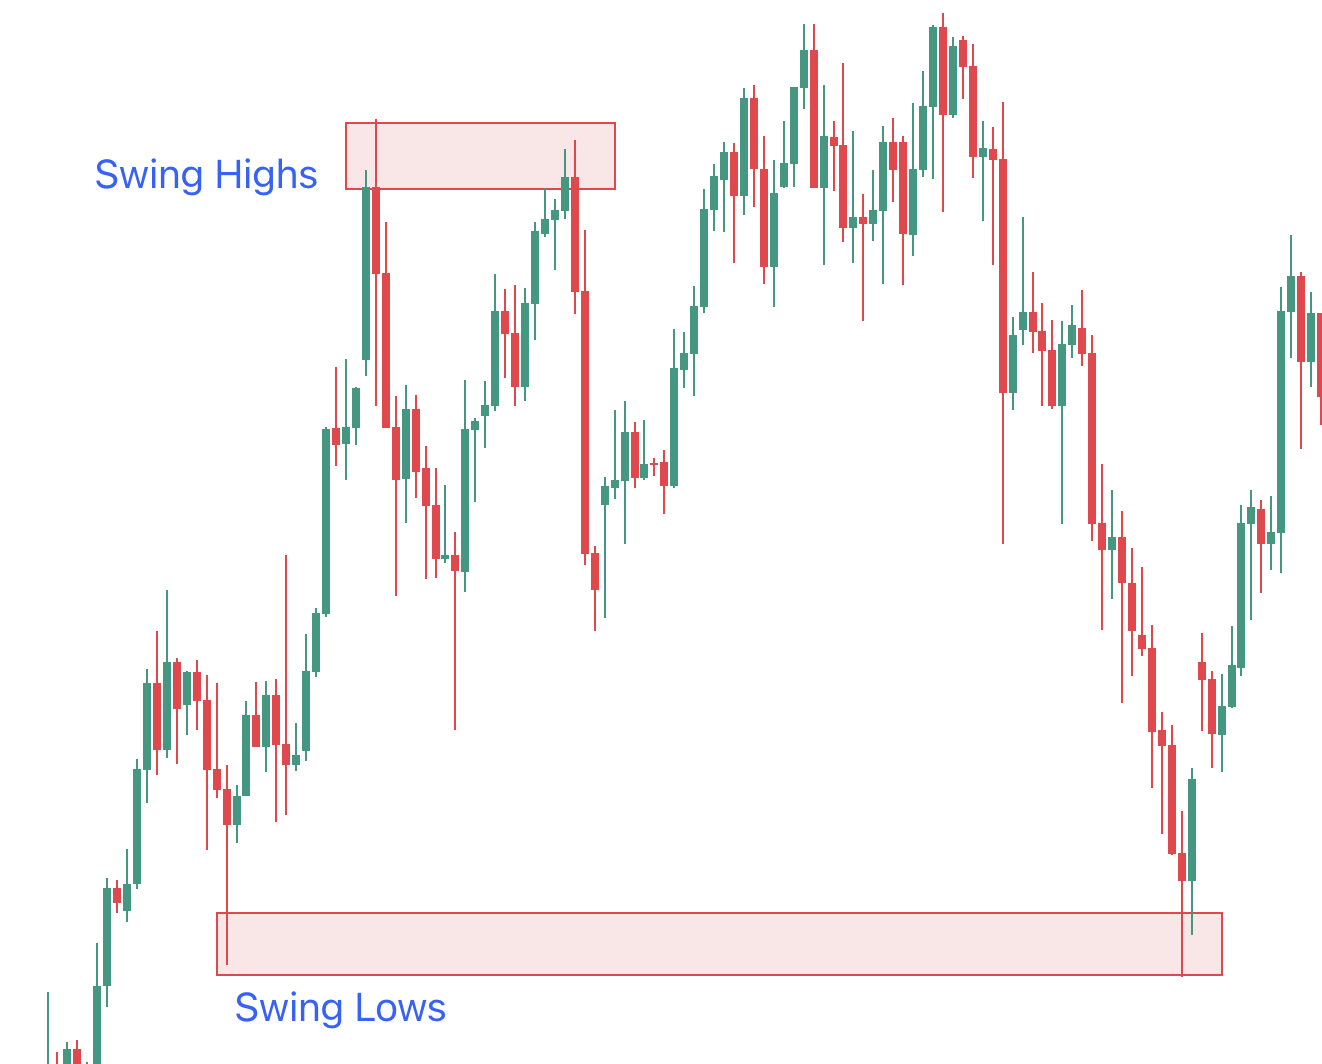
- Major consolidation zones
- Psychological price levels such as 5600, 5400, or 4500
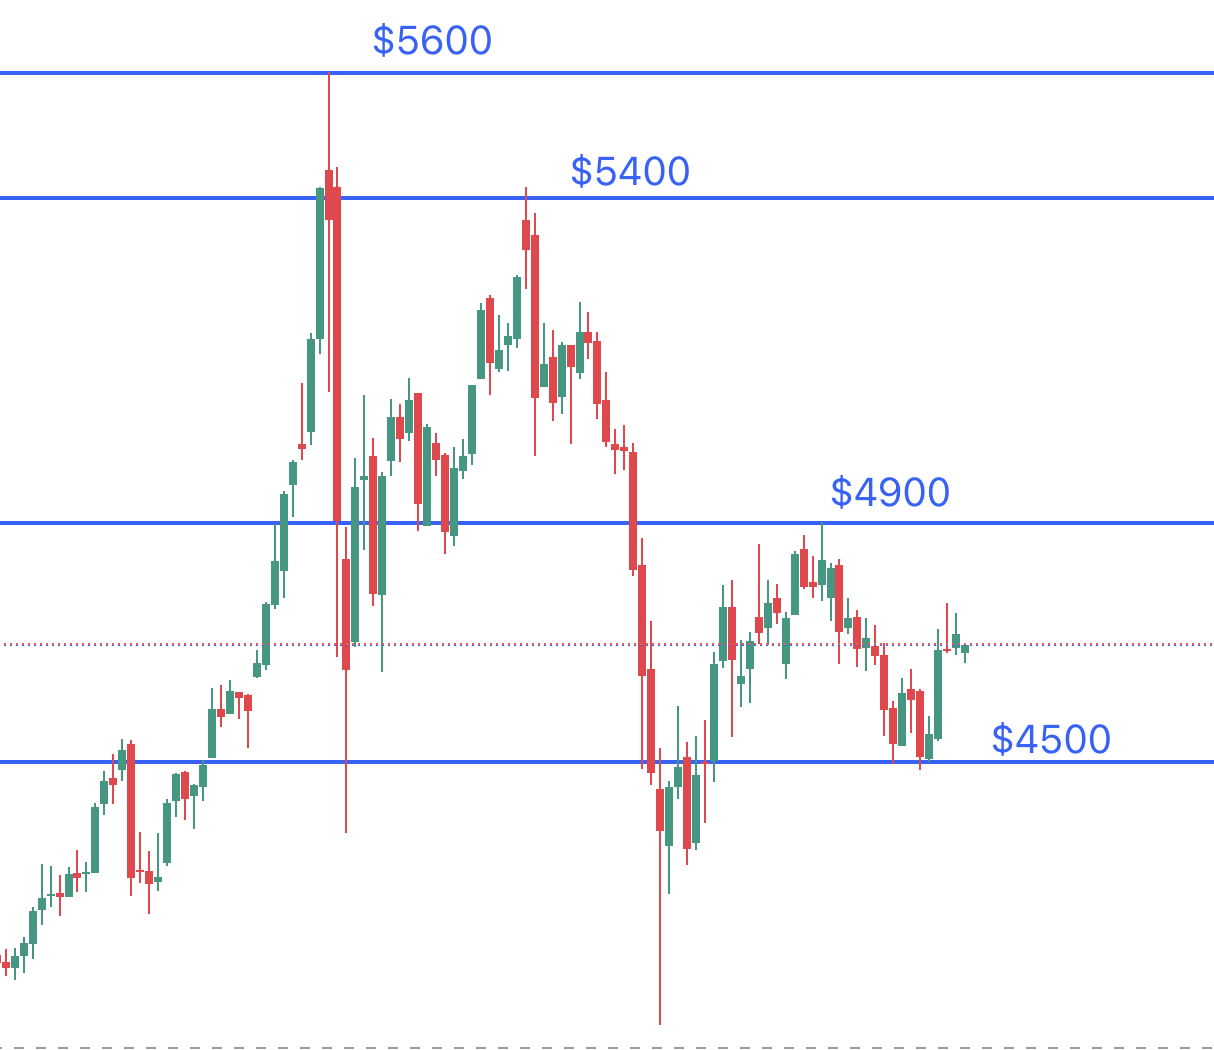
These levels act as reference points where buying or selling pressure may return. However, traders should avoid treating them as exact lines. Gold frequently reacts slightly above or below a level before reversing direction, which is why support and resistance are better viewed as zones.
3. Understand Market Structure
Market structure helps traders determine whether the current trend is likely to continue or reverse.
A bullish structure is typically seen when:
- Price breaks previous highs
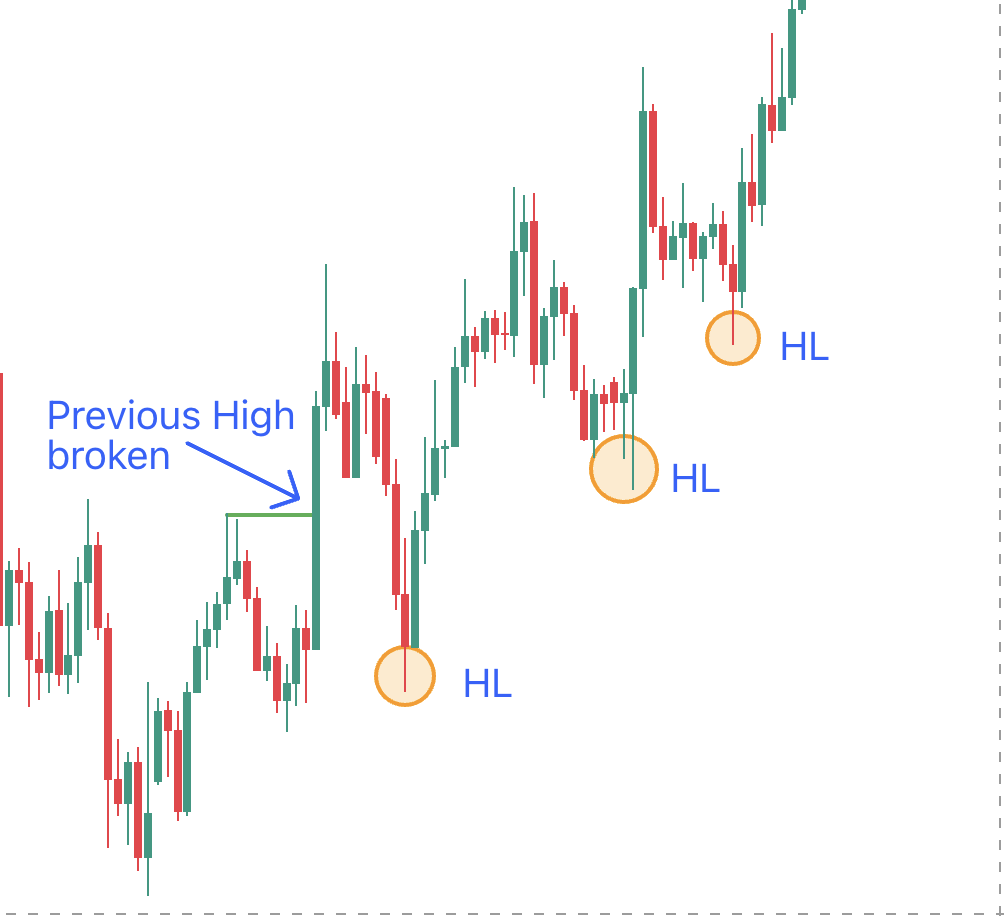
- Higher lows continue to form
A bearish structure is usually identified when:
- Price breaks previous lows
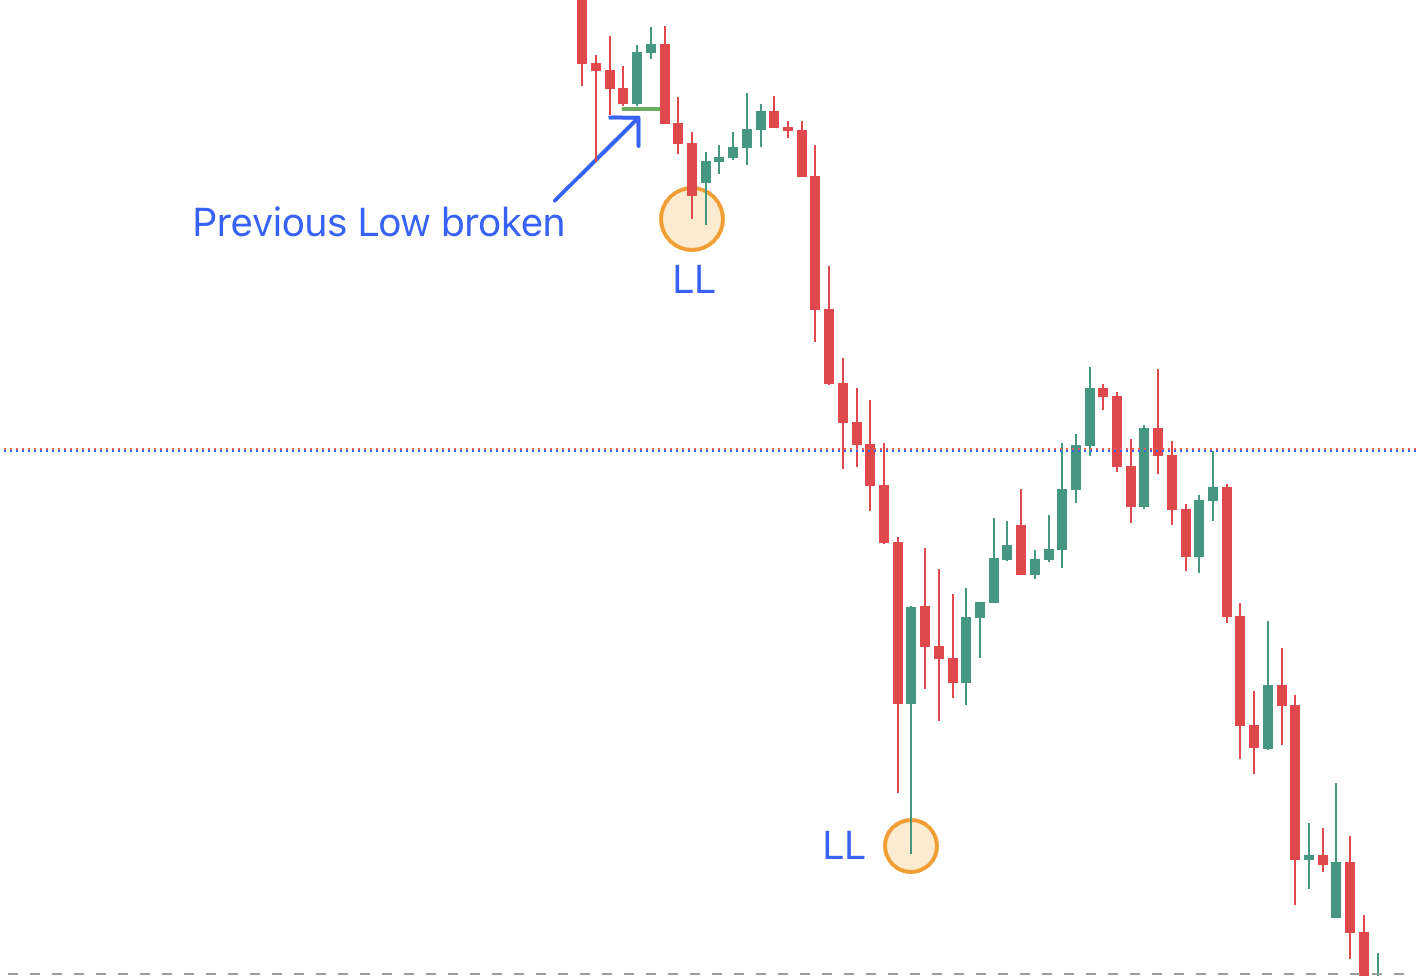
- Lower lows continue to appear
A change in structure can often signal a shift in market sentiment and may provide early clues of a potential reversal.
4. Observe Price Reaction at Key Levels
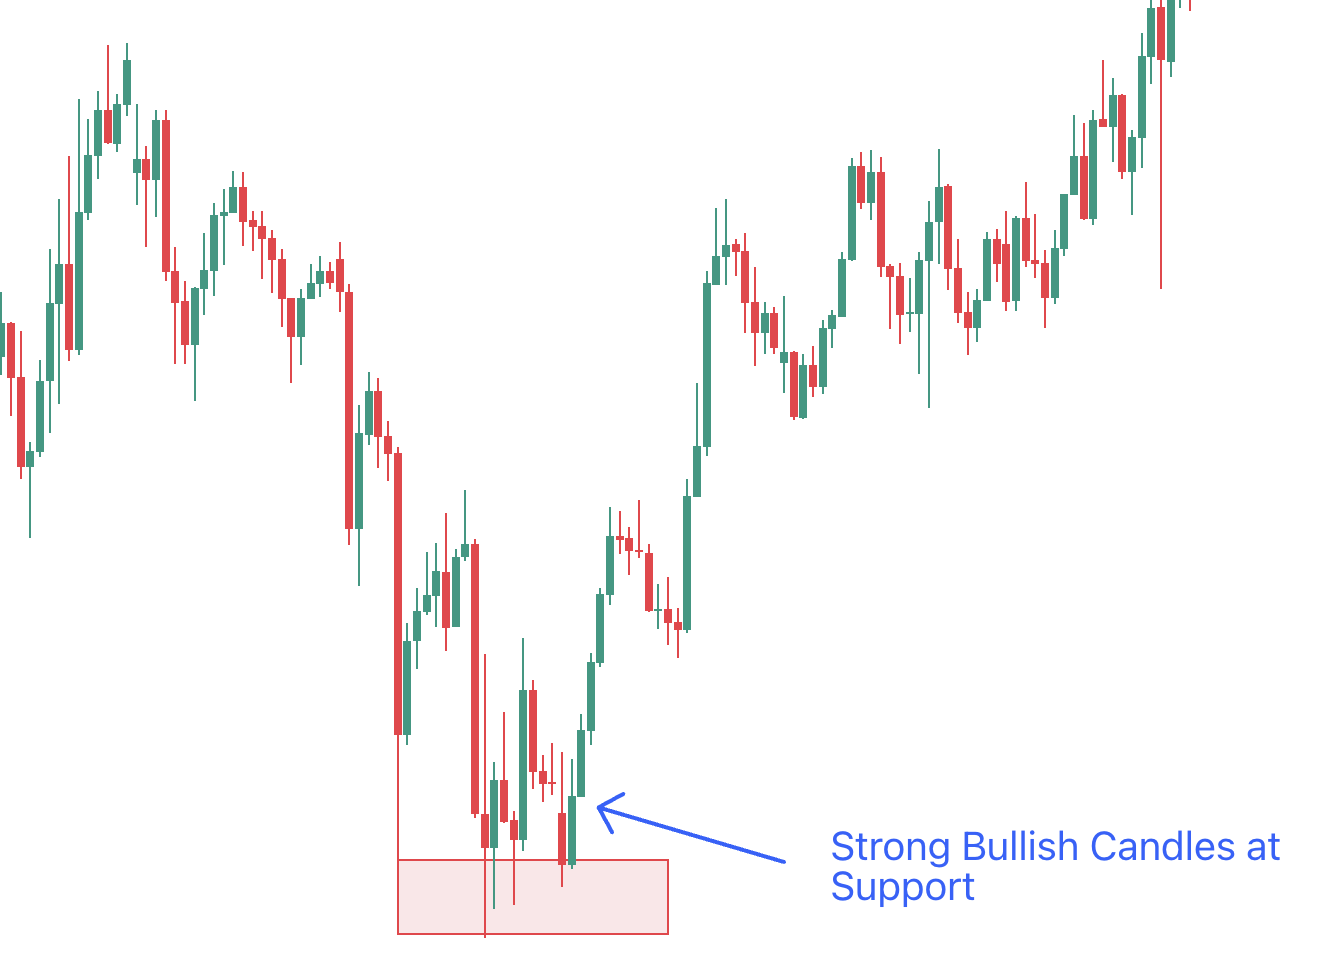
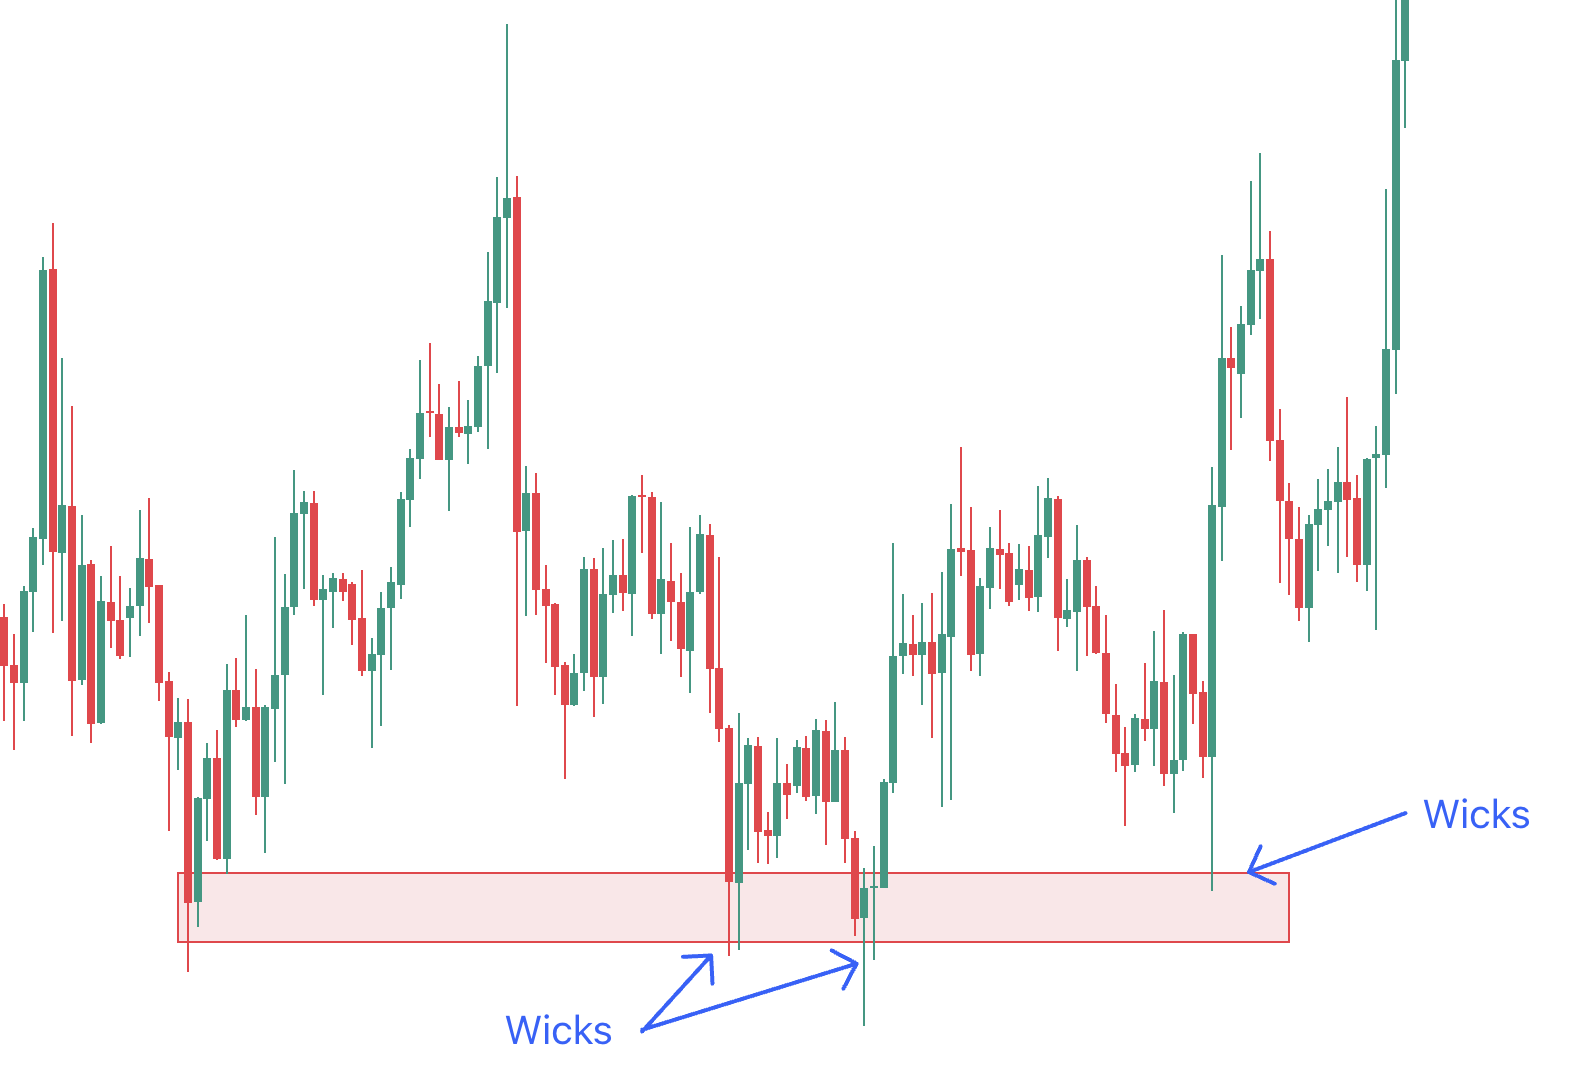
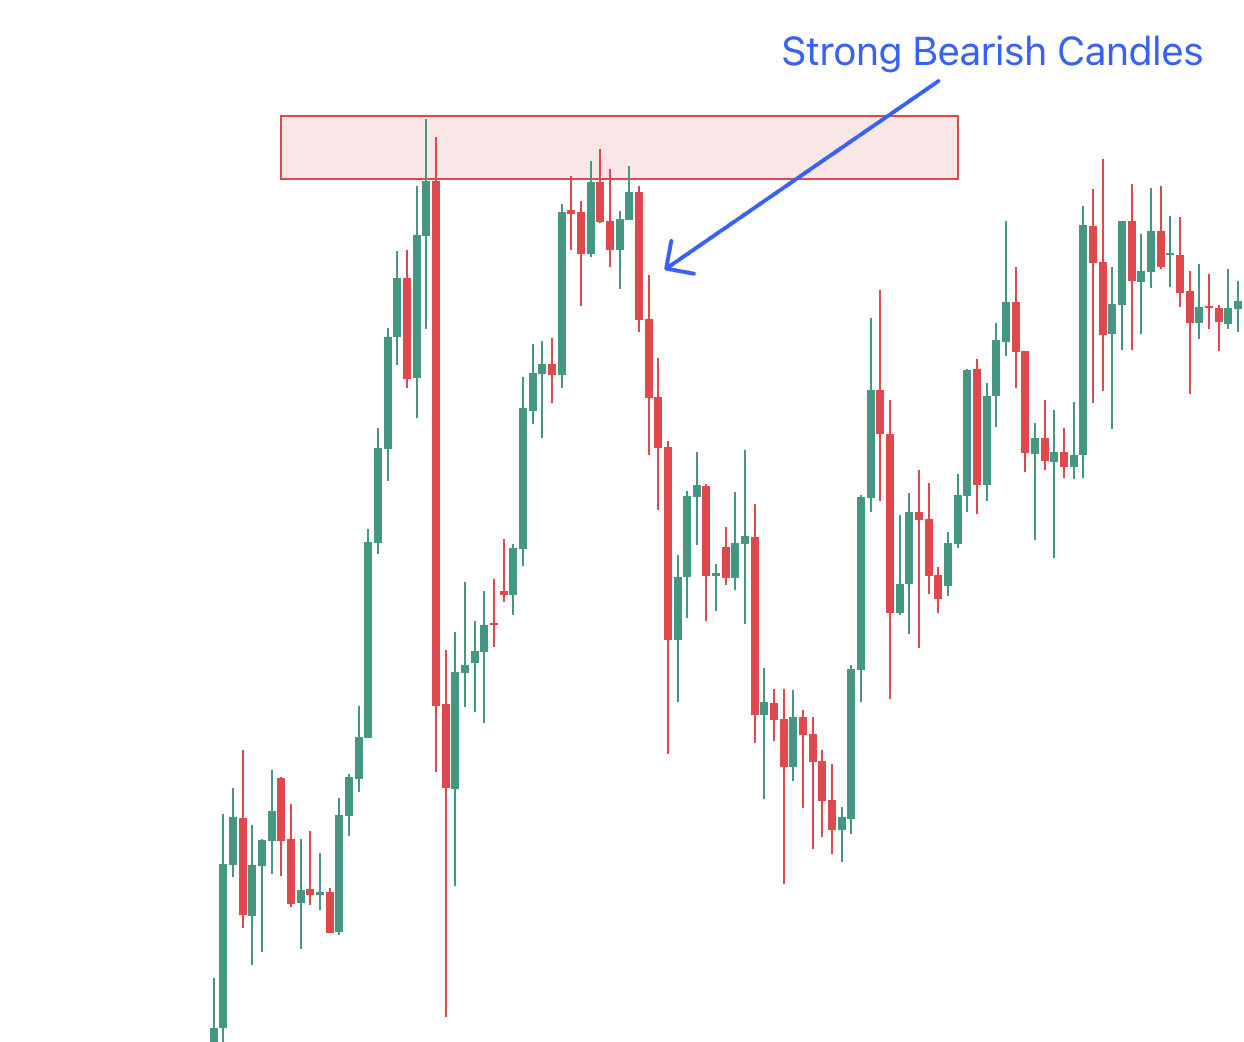
Once price reaches an important area, the next step is observing how the market reacts. Candlestick behaviour often provides valuable confirmation.
Common bullish reactions include:
- Strong bullish candles forming near support
- Long lower wicks showing rejection of lower prices
Common bearish reactions include:
- Strong bearish candles forming near resistance
- Long upper wicks showing rejection of higher prices
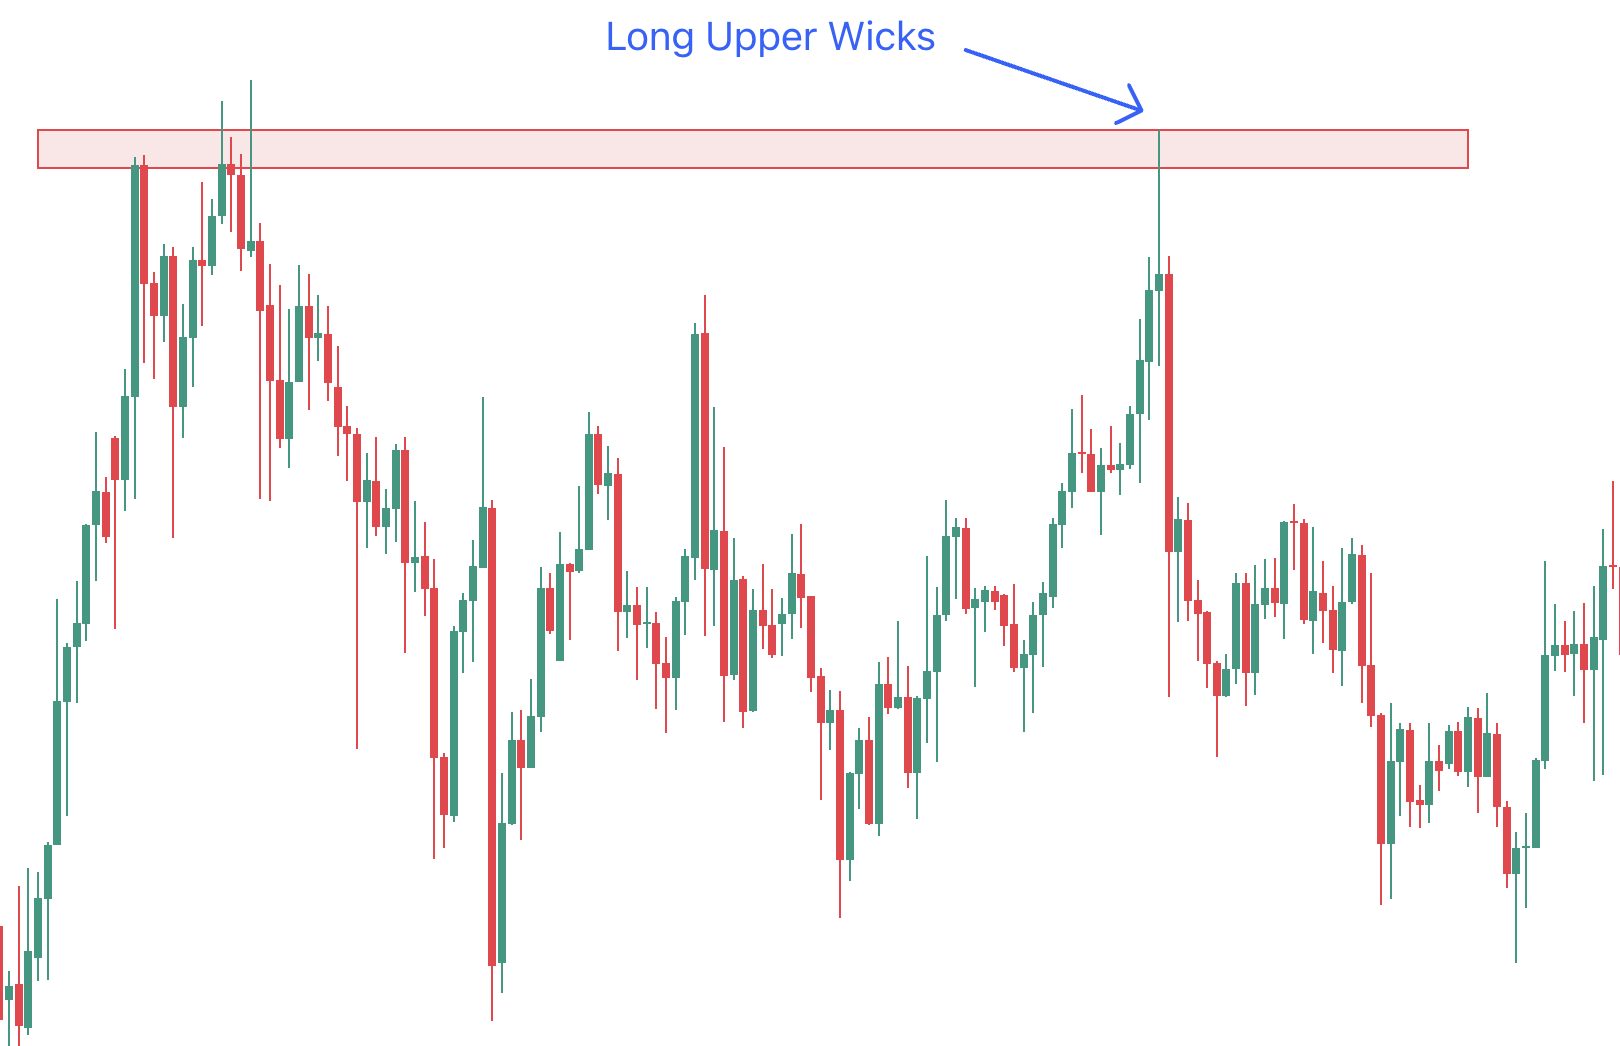
These reactions help traders assess whether a level is likely to hold or break.
5. Entry Approach (Basic Framework)
A structured approach to entries can help traders avoid emotional decision-making.
A simple framework includes:
1. Identify the prevailing trend
2. Mark relevant key levels
3. Wait for price to reach an area of interest
4. Observe for confirmation through price reaction
5. Enter only after confirmation appears, such as a strong rejection candle or breakout confirmation
Waiting for confirmation often improves trade quality and reduces premature entries.
6. Avoid Low-Quality Areas
Not all price zones offer good trading opportunities. Many beginner mistakes come from entering trades in areas where there is little structure or no clear market reaction.
It is generally better to avoid trades when:
- Price is in the middle of a range
- No clear structure is present
- There is no interaction with key levels
- Price movement is choppy or inconsistent
Higher-quality setups are usually found near clearly defined support or resistance zones where price reaction is easier to interpret.
7. Optional Use of Indicators
Indicators should be viewed as supporting tools rather than primary decision-makers.
One commonly used indicator is the Moving Average, such as the 50-period moving average:
- Price above the moving average may support a bullish bias
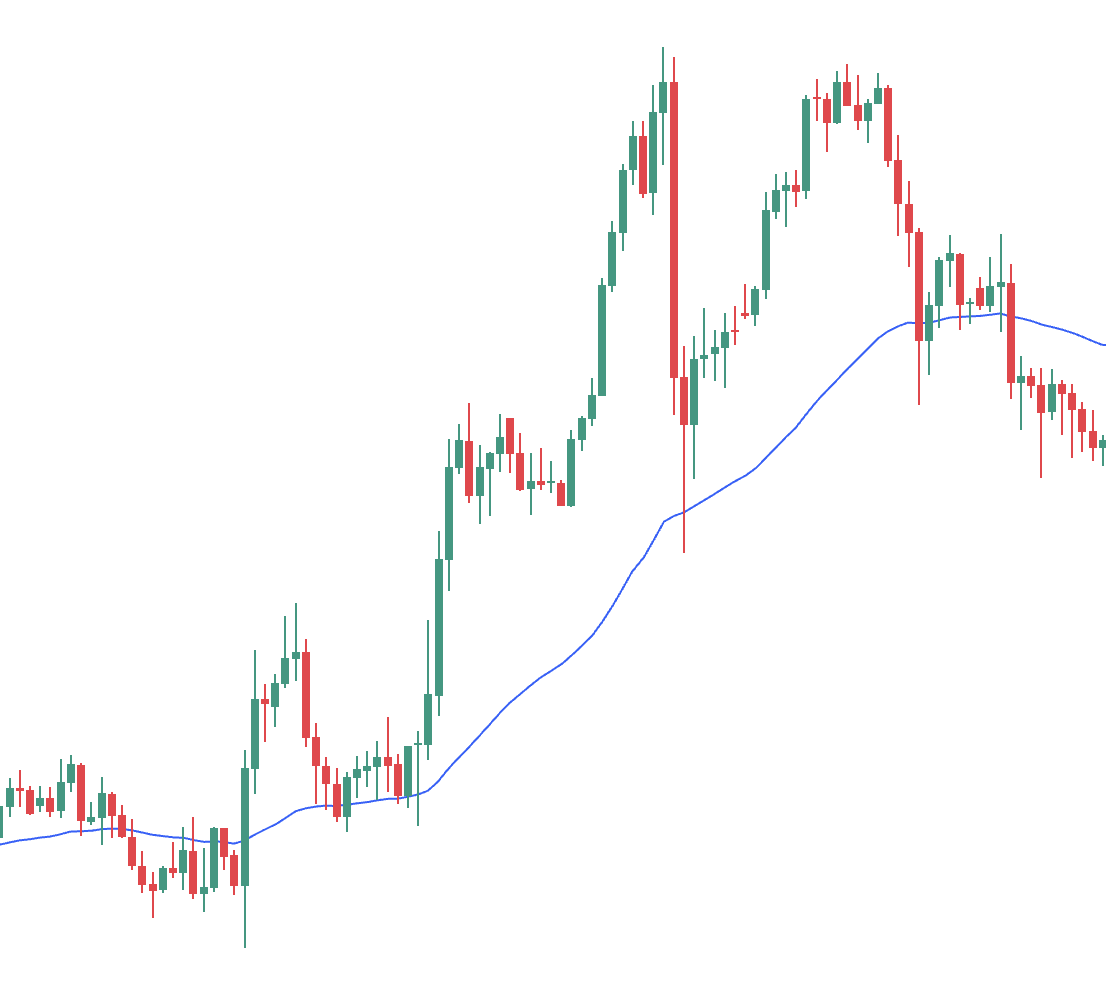
- Price below the moving average may support a bearish bias
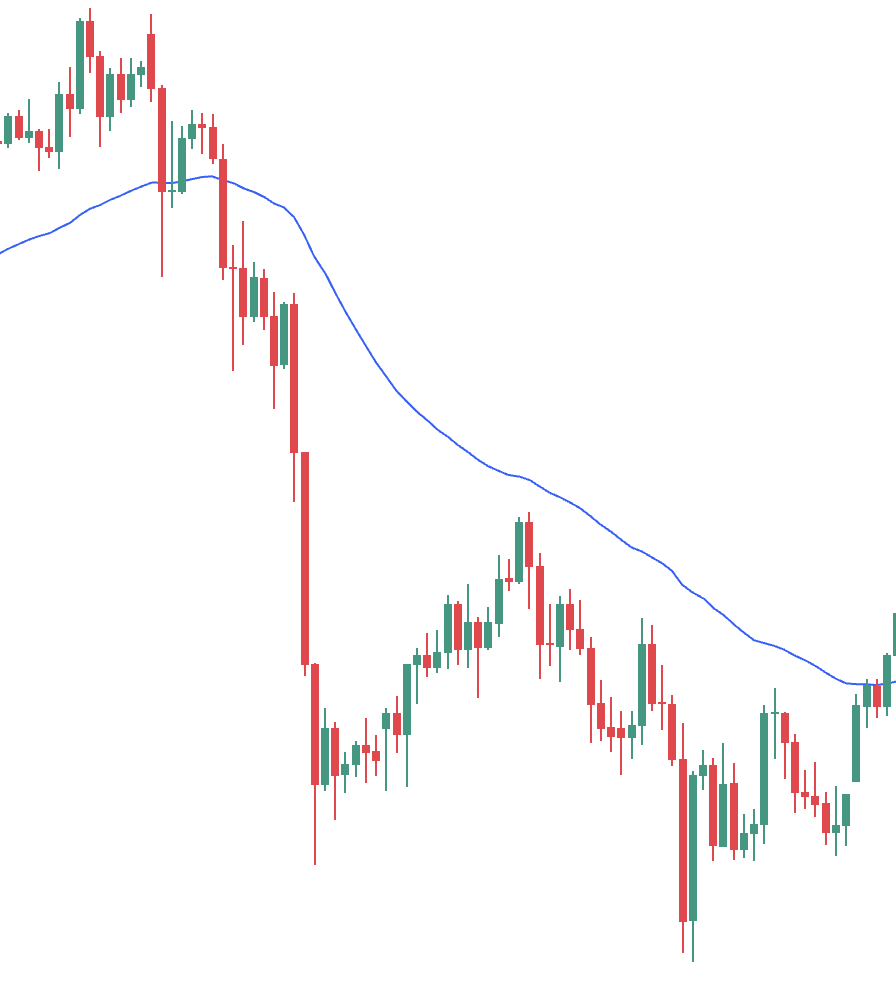
However, price structure and market behaviour should still remain the main focus when analysing gold charts.
Conclusion
Reading gold charts effectively comes down to three core principles:
- Understanding market direction
Knowing whether the market is trending upward, downward, or moving sideways helps traders align with overall momentum instead of trading against it. Following the broader direction often improves trade quality and reduces unnecessary risk.
Support and resistance zones act as important decision areas where buyers and sellers tend to react. These levels help traders anticipate potential reversals, breakouts, or continuation moves and provide structure for planning entries and exits.
- Observing price reaction at those levels
Price behaviour near key areas often reveals market sentiment. Strong rejection candles, breakouts, or momentum shifts can provide confirmation before entering a trade, helping traders avoid impulsive decisions.
With consistent practice, traders can gradually develop a more structured and disciplined approach to analysing gold charts. Rather than relying on random entries or excessive indicators, focusing on price action, market structure, and key levels often leads to clearer decision-making and better overall trade execution.