
WHAT IS A CANDLESTICK?
WHAT ARE THE BASIC CANDLESTICK PATTERNS?
Since candlesticks are created based on the upward and downward movement of prices, they may look random at first glance. But these candlesticks form patterns that traders look into in analysing market movements and making the right trading decisions.
Let’s take a look at the bullish candlestick patterns. We are all familiar with the long black line that encompasses a real body and represents an extremely strong movement. This is one of the most attractive patterns that traders want to see on charts.
Here are 5 powerful bullish candlestick patterns:
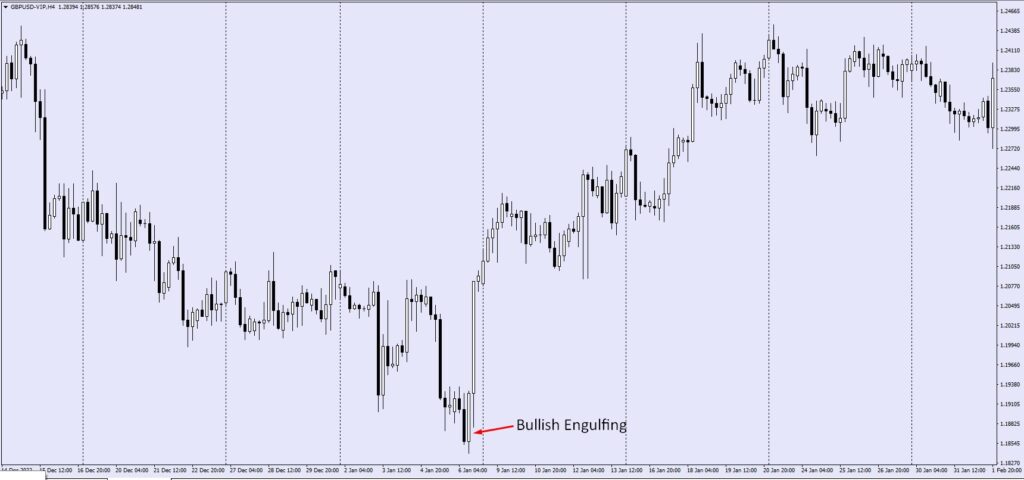
1. Bullish engulfing pattern
In a bull market, the bullish engulfing pattern represents when buyers are more in control than the sellers. Here, you’ll see a long green real body engulfing a small real body, which indicates that buyers have more leverage, and prices could go up.
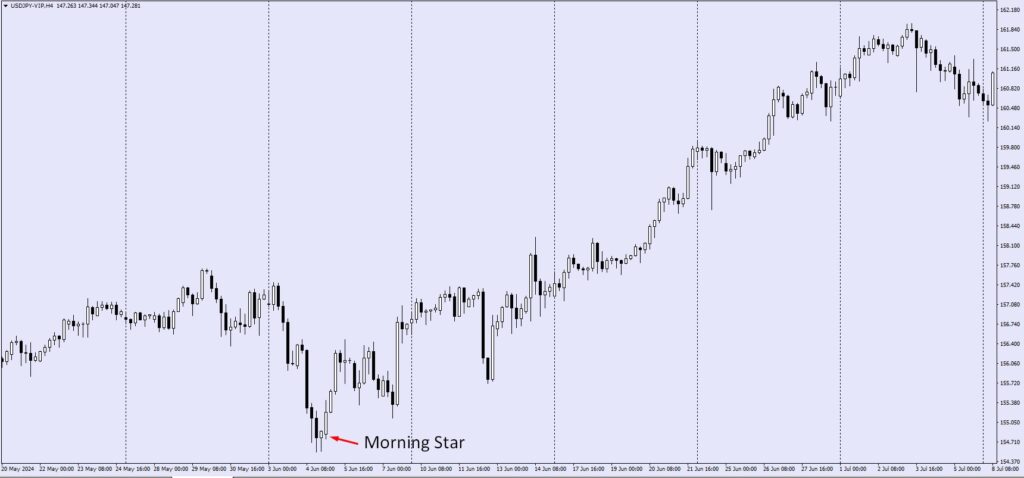
2. The Morning Star
A morning star is a pattern that indicates the start of an upward climb following a downward trend. A bullish signal is generated when three candles appear in a row, with one session showing a long body and the other two forming small bodies. Most traders watch for this signal because it can help predict future market moves up or down.
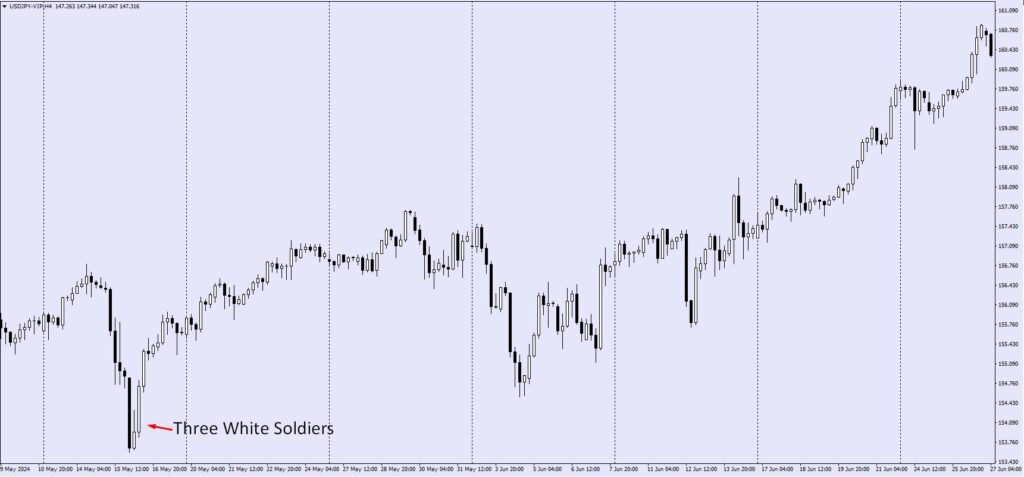
3. Three White Soldiers
Three White Soldiers is a bullish candlestick pattern that consists of three consecutive long white candlesticks. This indicates that the bears are losing grip on their control, and the bulls are taking over. The longer the successive candles, the more significant it is. It has one of the highest reliability rates among all reversal candlesticks, with a minimum requirement for at least 3 consecutive white candles to form this pattern.
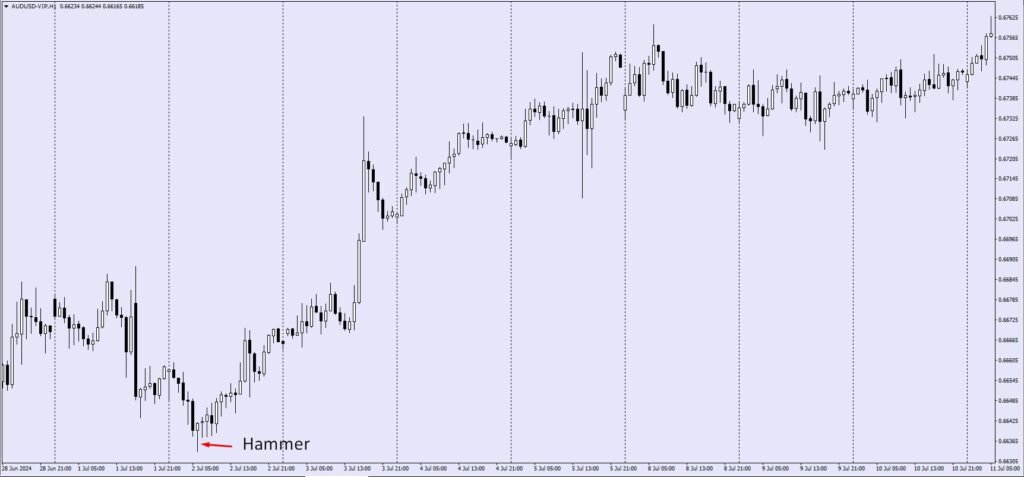
4. Hammer
The Hammer Candlestick Pattern is a bullish reversal pattern that signals a potential reversal of the current downtrend. It has a long black body followed by a small white body, with the lower shadow of the black body extending well below its high point. The Hammer is a popular phenomenon for candlestick pattern traders to watch as it can signal an upcoming price change in either direction of an asset’s price action.
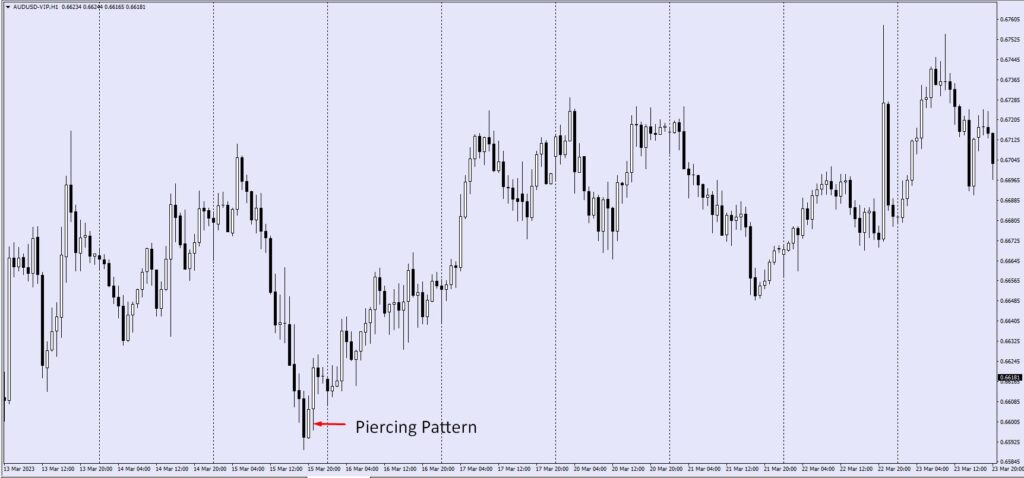
5. The Piercing Pattern
The Piercing Pattern is a bullish reversal pattern, which occurs after a downtrend and signals that the market is reversing to the upside. The first candlestick of this formation is called a white body and has a long upper shadow, while the second one has no shadow at all.
You can use these bullish candlestick patterns to find good entry points. The three white soldiers, for example, is a reversal pattern that indicates the market bottom and the beginning of a new up-trend. A bullish engulfing pattern can be used as an entry point when the price breaks above the resistance level. The morning star pattern has a high probability of success because it forms after a downtrend and signals an upward price movement.
BEARISH CANDLESTICK PATTERNS
Bearish candlestick patterns are used to predict market reversals. A reversal pattern can be thought of as a warning sign that something has changed and it is time to take action. Here are 5 of the most popular bearish candlestick patterns.
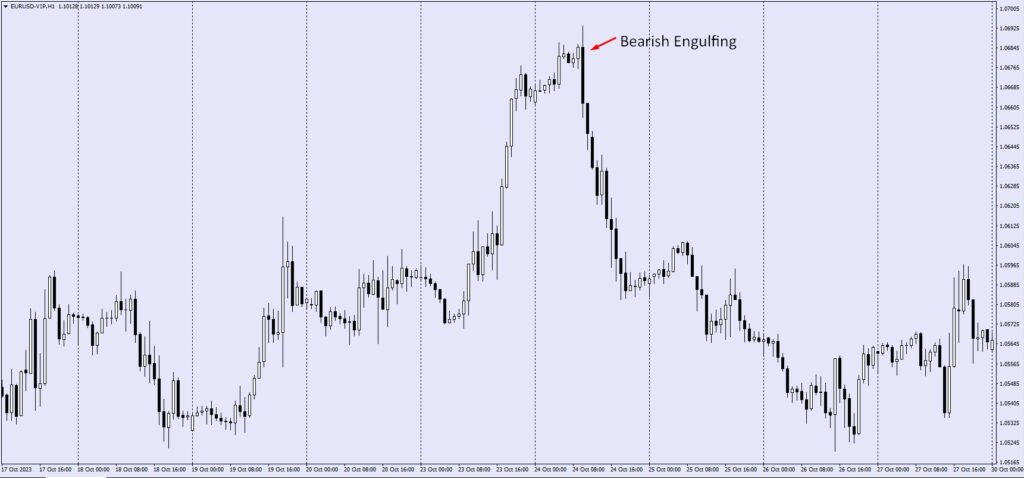
1. Bearish Engulfing Pattern
Like the bear trend, this pattern develops during an uptrend when there are more sellers than buyers. Here, you’ll see a long red real body engulfing a small green real body, which indicates that the sellers have more leverage and prices could go down.
Source: dailyfx.com
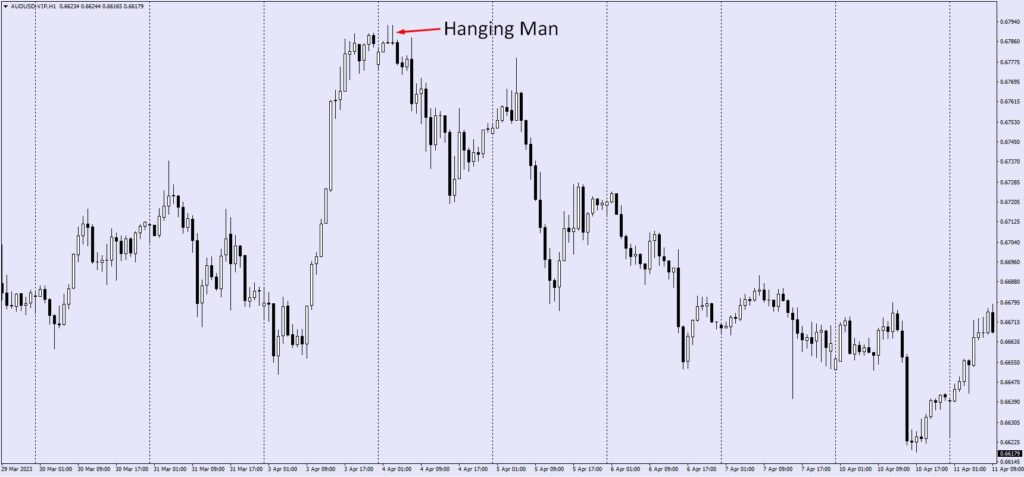
2. Hanging Man
The Hanging Man is a single candlestick with a long lower shadow. This pattern is considered a bearish reversal pattern and can be used for trend reversals and the continuation of a falling market.
The long lower shadow indicates that the price opened higher than it closed but fell during the session. The upper shadow is shorter than the body or wicks, which shows that prices closed near their low for the day. The opening price must be well above the closing price to qualify as a hanging man pattern; otherwise, it would be classified as an evening star instead.
3. Bearish Evening Star
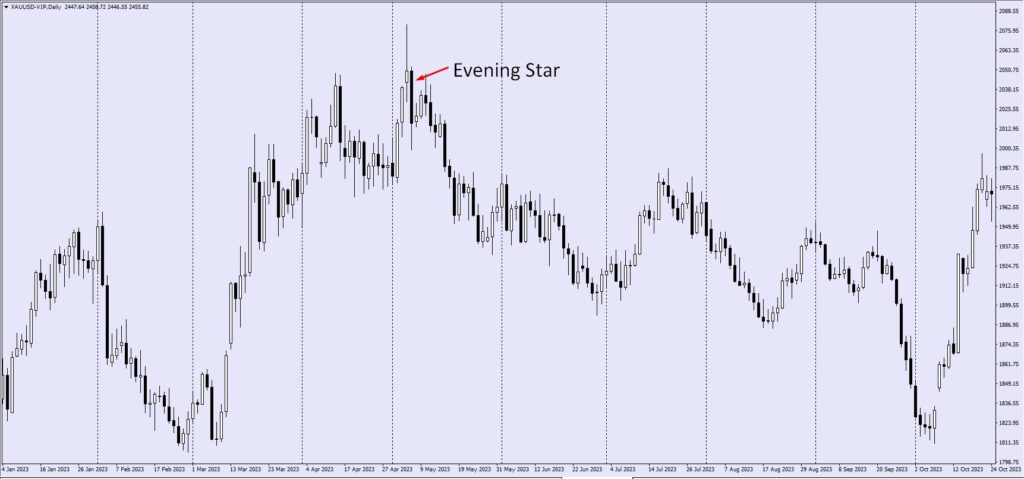
An evening star is indicative of a topping pattern, which is represented by the last candle on the pattern opening right below the small real body from the previous trading day that can either be red or green. A bearish evening star means buyers are stalling, and there’s more active selling on the market.
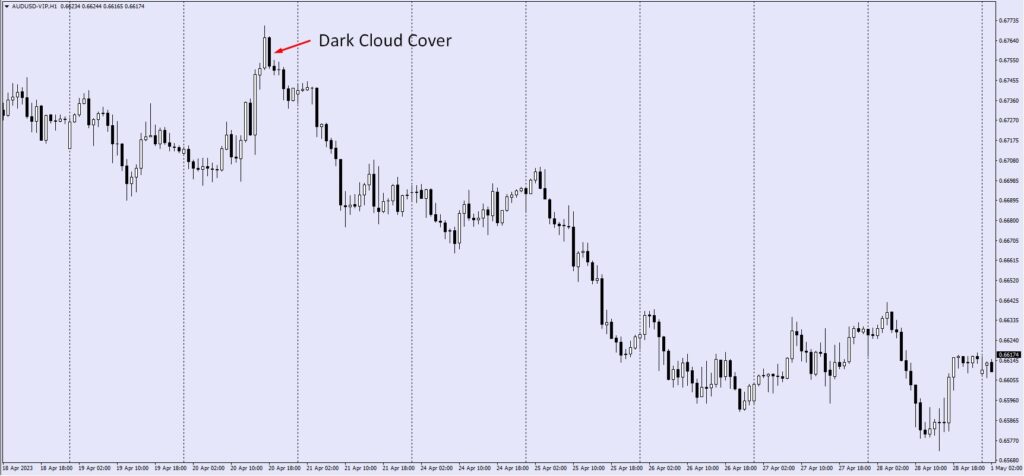
4. Dark Cloud Cover
The Dark Cloud Cover is a bearish pattern that occurs when a small bearish candle follows a large bullish candle, which is completely engulfed by the large bullish candle. The pattern indicates that the bulls are losing momentum and that their price rally may end soon. It’s also considered to be a continuation pattern because it forms after an uptrend has been in place for some time.
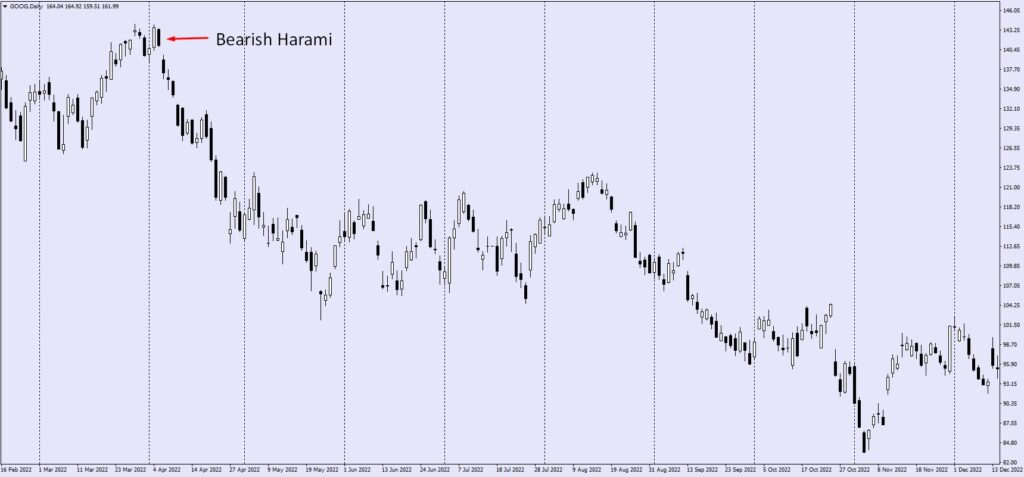
5. Bearish Harami
Indicating that there’s indecision on the part of buyers, a bearish harami is something that you should watch because it can lead to a further uptrend or if a down candle follows the pattern, it could mean that prices will be sliding.
CONTINUATION CANDLESTICK PATTERNS
Traders use these patterns to confirm market direction and help you make informed buying and selling decisions.
Here are 5 of the most popular patterns.
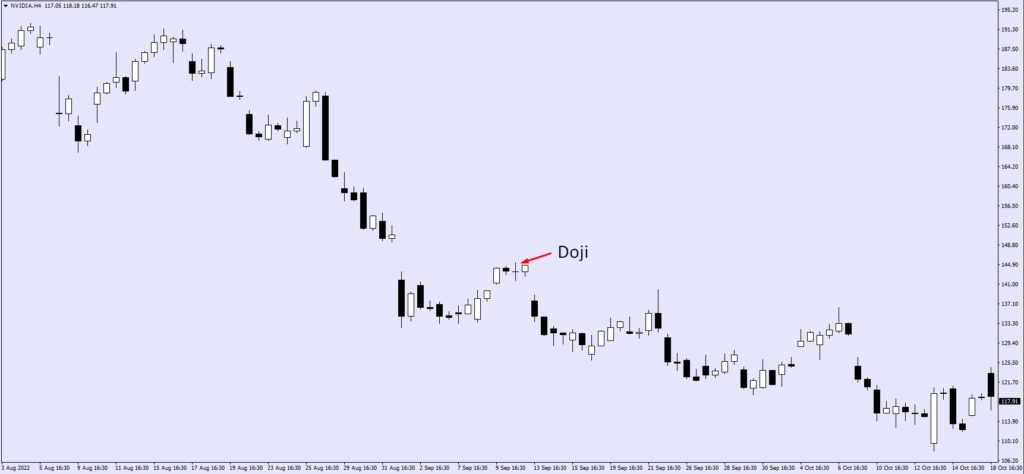
1. Doji
The Doji is one of the most widely used and popular candlestick patterns. A Doji is a candlestick with a small body (less than half the length of the previous day’s body) and no upper or lower wick. It is a sign of indecision, which can be interpreted as evidence that buyers and sellers are evenly matched, so there isn’t any clear direction for a price to go in next.
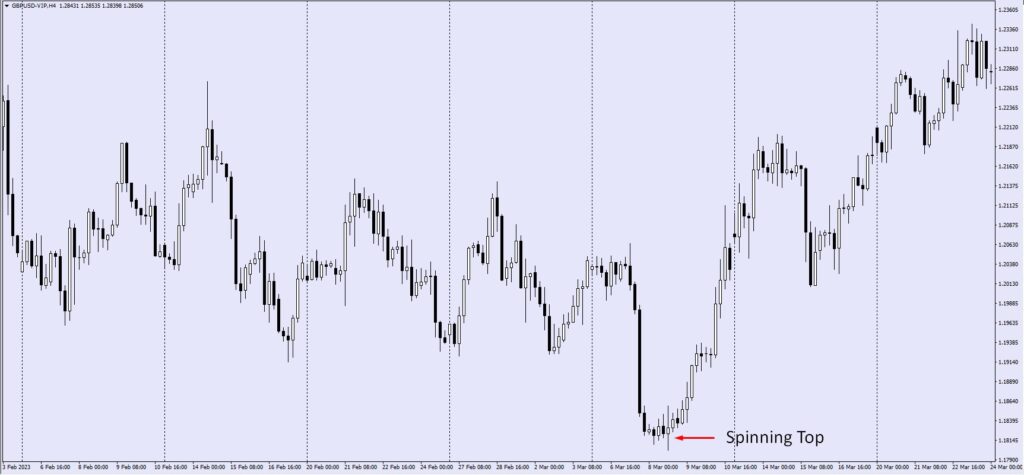
2. Spinning Top
A spinning top candle is a candlestick with a small body and a long wick. It’s called “spinning top” because it looks like it’s about to fall over but never does.
This pattern is considered either bearish or bullish, depending on the previous market trend and other factors like volume, price action, and open interest in the option you’re trading.
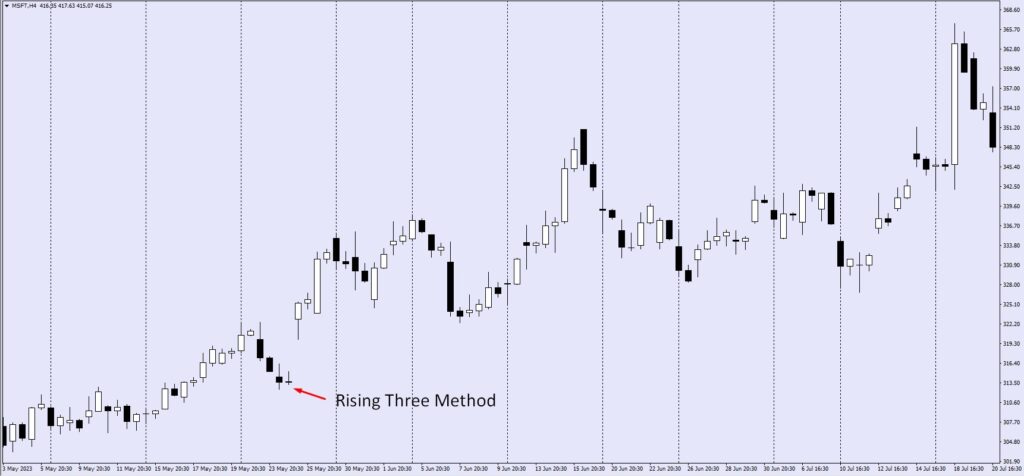
3. Rising Three Methods
The Rising Three Methods pattern is a bullish reversal pattern that consists of three candles. The first candle on the chart represents the uptrend, while the second and third candles represent a price decline. The third candle closes above the second candle’s midpoint, creating a new high.
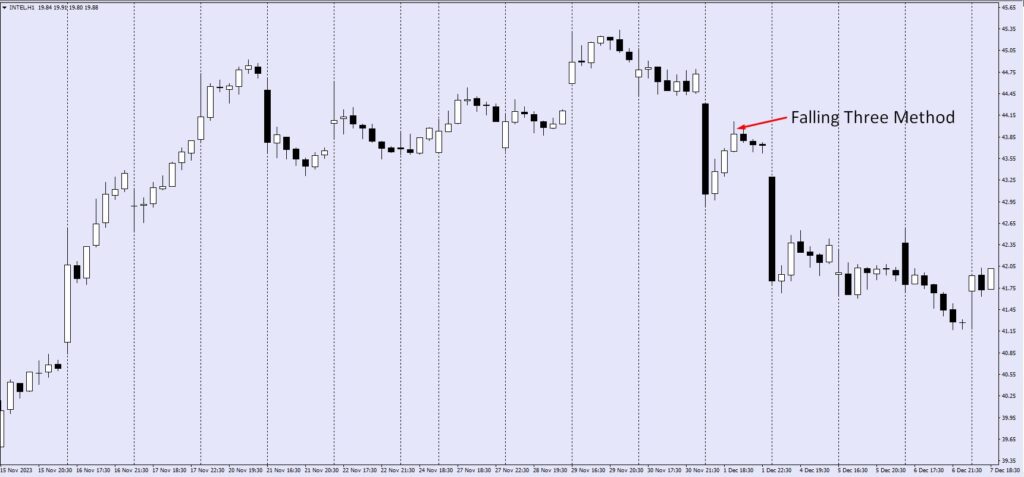
4. The Falling Three Methods
The Falling Three Methods pattern is a reversal pattern consisting of three candles, three long-bodied red (or black) candles followed by two long-bodied green (or white) candles.
The first candle in this pattern is usually a Doji candle or an Engulfing candle. The third and fifth candles can be either Bearish Engulfing Candles or Dark Cloud Cover Candles.
5. Mat-Hold Candlestick Pattern
Mat-hold candlestick pattern is a bullish reversal pattern that indicates that the bulls are in control. It is made up of a long black candle with a smaller white body and then a Doji candlestick that appears above the high of the first black candle. This means that the bears have been exhausted, and bulls are ready to take over again. To trade this pattern, wait for confirmation signals such as price breaking above resistance levels or falling through support levels after they form within successful patterns like Hanging Man Candlesticks.
TAKEAWAY
Centuries ago, the Japanese discovered that emotions play a huge part in how investors make decisions when trading, and it also influences how assets move. Today, candlestick patterns continue to guide traders on the choices they need to make, depending on how the market is going and the attitude of other traders.
So, if you’re new to trading, make sure that you learn all about candlestick patterns and the other basic strategies that will help you make the right choices. You are making a huge investment, after all, and it only makes sense that you master the craft to succeed.
Start your trading journey.
3 easy steps to start your path to trading success